How to Set Up kTool for Your First Session
kTool
·
·
3 min read
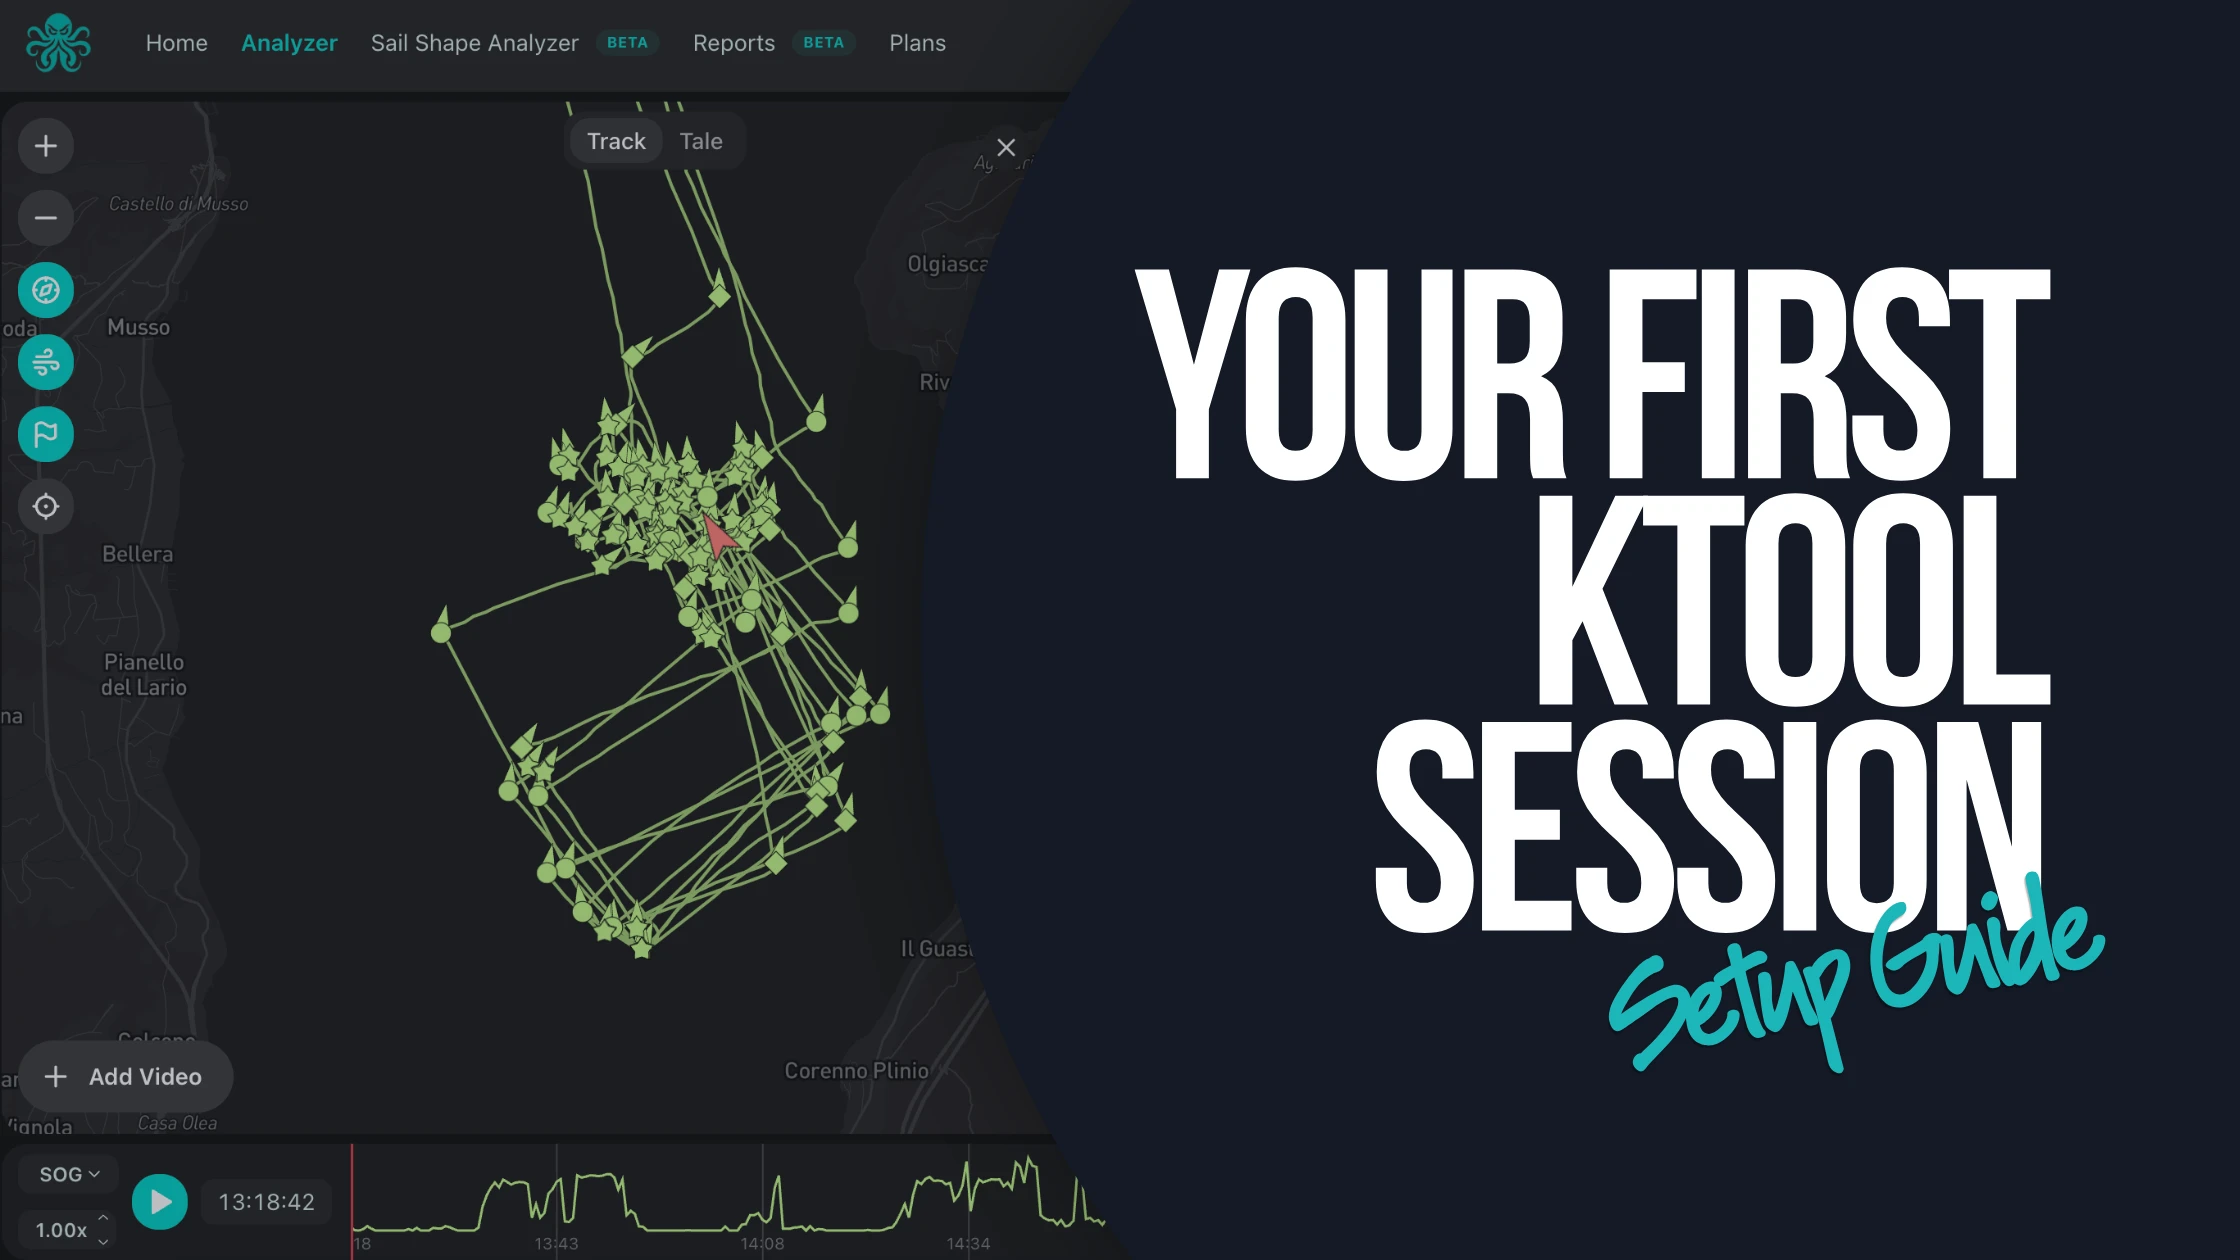
Getting from "I have a GPS track" to a full performance debrief takes just a few steps.
Here's exactly how to set up kTool and get your first session analyzed.
Step 1: Sign Up — No Card Needed
Head to kTool and start free. You don't need a payment card to get going — you can analyze your first sessions and explore a demo session immediately after signing up, so there's no reason to wait until you've "figured out" the software first. If later you decide you want more, adding a card unlocks a 15-day free trial.
Step 2: Create a Boat Profile
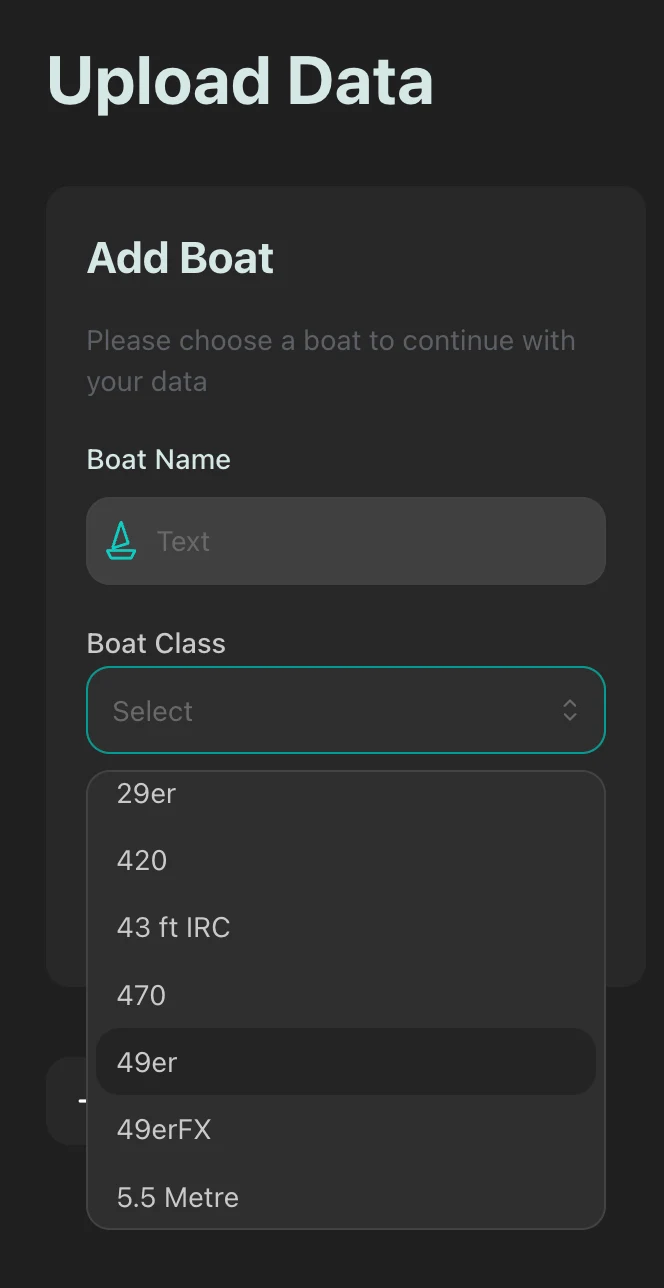
Before uploading any data, set up a boat profile. This links your sessions to a specific boat and class, which matters because your performance targets, polar data, and maneuver benchmarks are all boat-specific. If you sail more than one boat — a dinghy and a keelboat, say, or multiple crews on the same class — give each its own profile so your data stays organized and comparable.
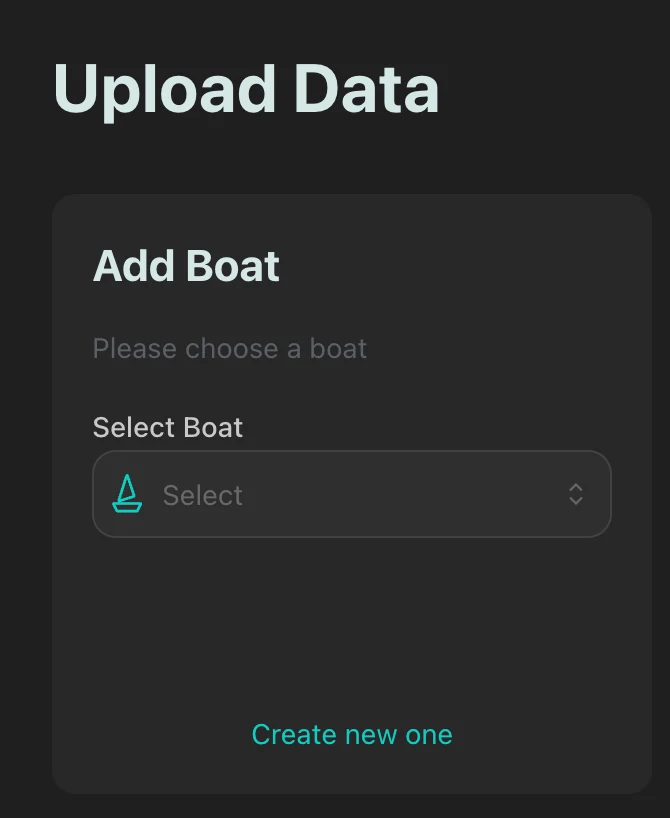
Step 3: Upload Your Session Data
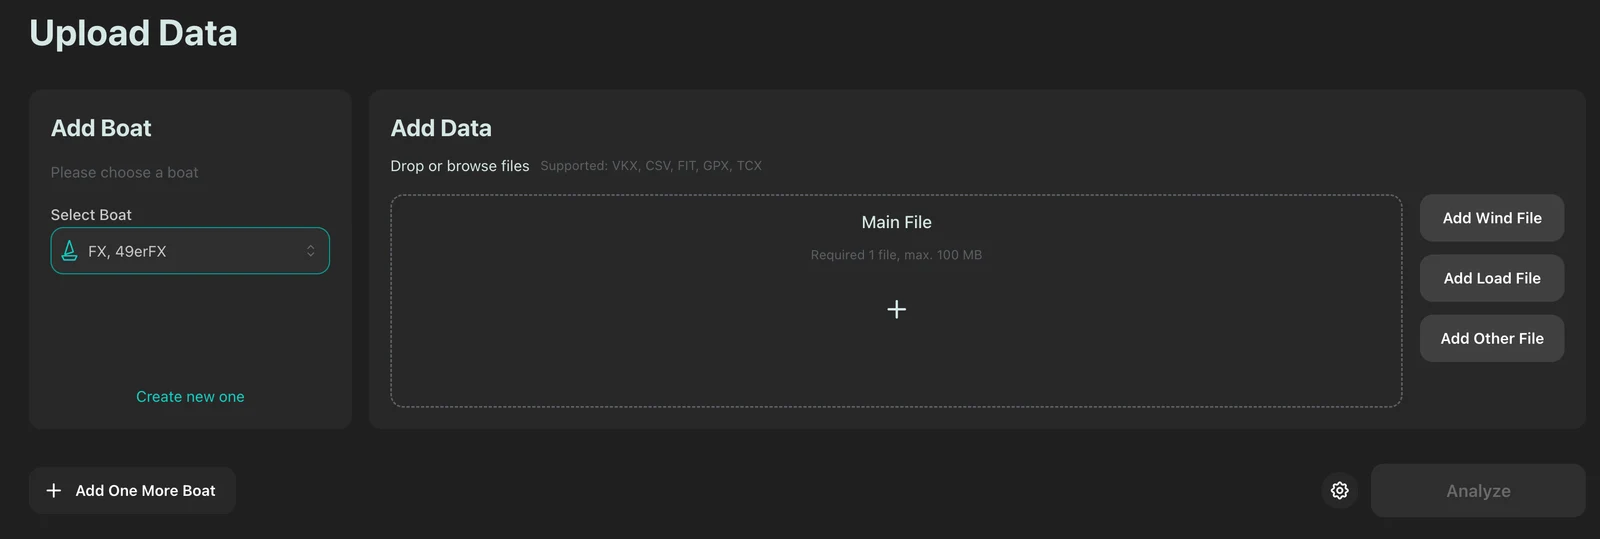
kTool doesn't require proprietary hardware. It works from whatever your GPS or logging device already produces. CSV, GPX, VKX, FIT, and other common formats are supported. For the cleanest analysis, aim for GPS data logged at 5Hz or higher; low-frequency data can still be analyzed, but higher resolution gives kTool more to work with when detecting maneuvers precisely.
If you have them, you can also add Wind, Load or any other file. They will be considered when running the data, but they are not essential.
Step 4: Add Video (Optional, But Worth It)
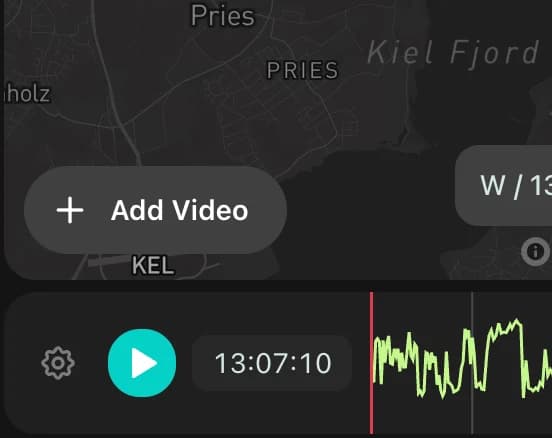
If you have onboard, drone, or coach-boat footage from the same session, upload it too. As long as your devices have roughly correct time settings, kTool will automatically sync the video to your data timeline, so you can watch a maneuver and read the corresponding speed, angle, and VMG data at the exact same moment. You can add your videos also later, when reviewing the session.
Step 5: Let kTool Process the Session
Once uploaded, kTool automatically structures the session. It detects all the tacks, gybes, and straight-line sections, calculating wind direction directly from your GPS track, and computing the full set of performance metrics: VMG, heel, pitch, turning rate, and more.
Step 6: Explore Your Debrief
Your processed session appears under "Browse Old Data," where you'll find a summary (date, boat, wind conditions, duration) along with the full maneuver and straight-line breakdown. From here you can:
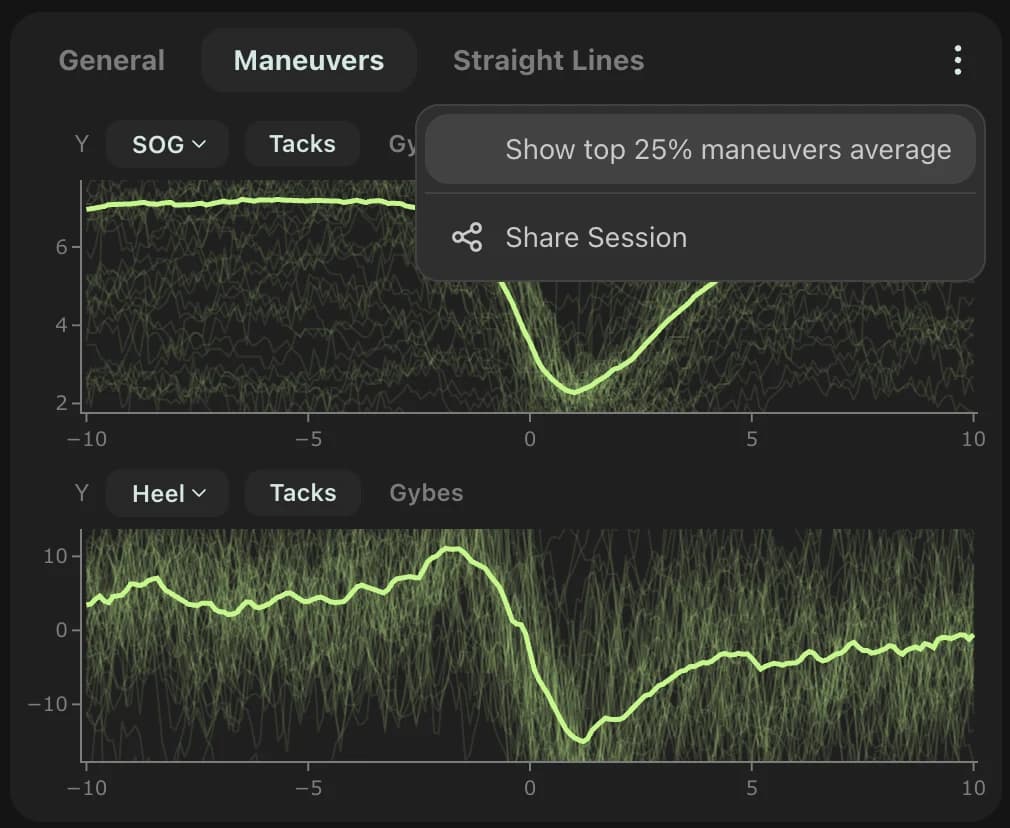
- Review individual maneuvers and compare them to your top 25%
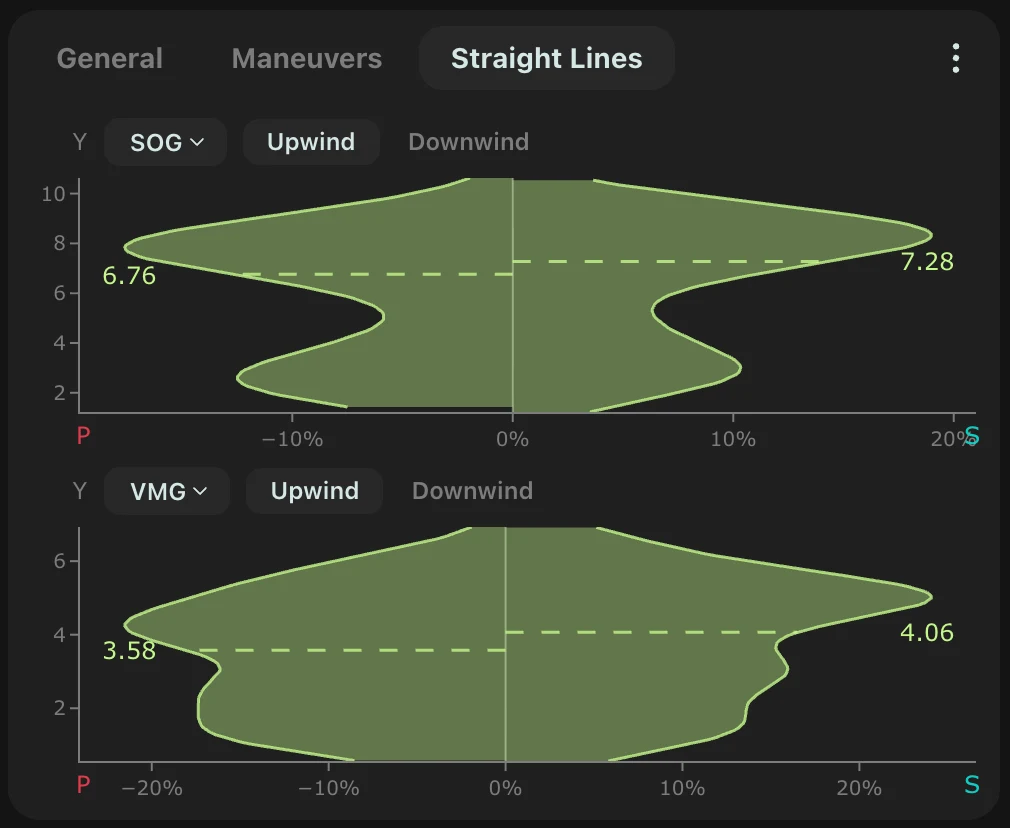
- Check straight-line performance across legs
- Watch synced video, if you uploaded any
- Select up to ten sessions at a time to compare side by side — useful for tracking whether a change in setup, technique, or training actually moved the needle
That's It
From upload to full debrief usually takes minutes, not hours. The real work starts once you're looking at your first session — but getting there is designed to be simple enough that you can do it straight off the water, while the details are still fresh.
Good sailors train hard.The best ones train smart.
Start free — no cardRelated posts