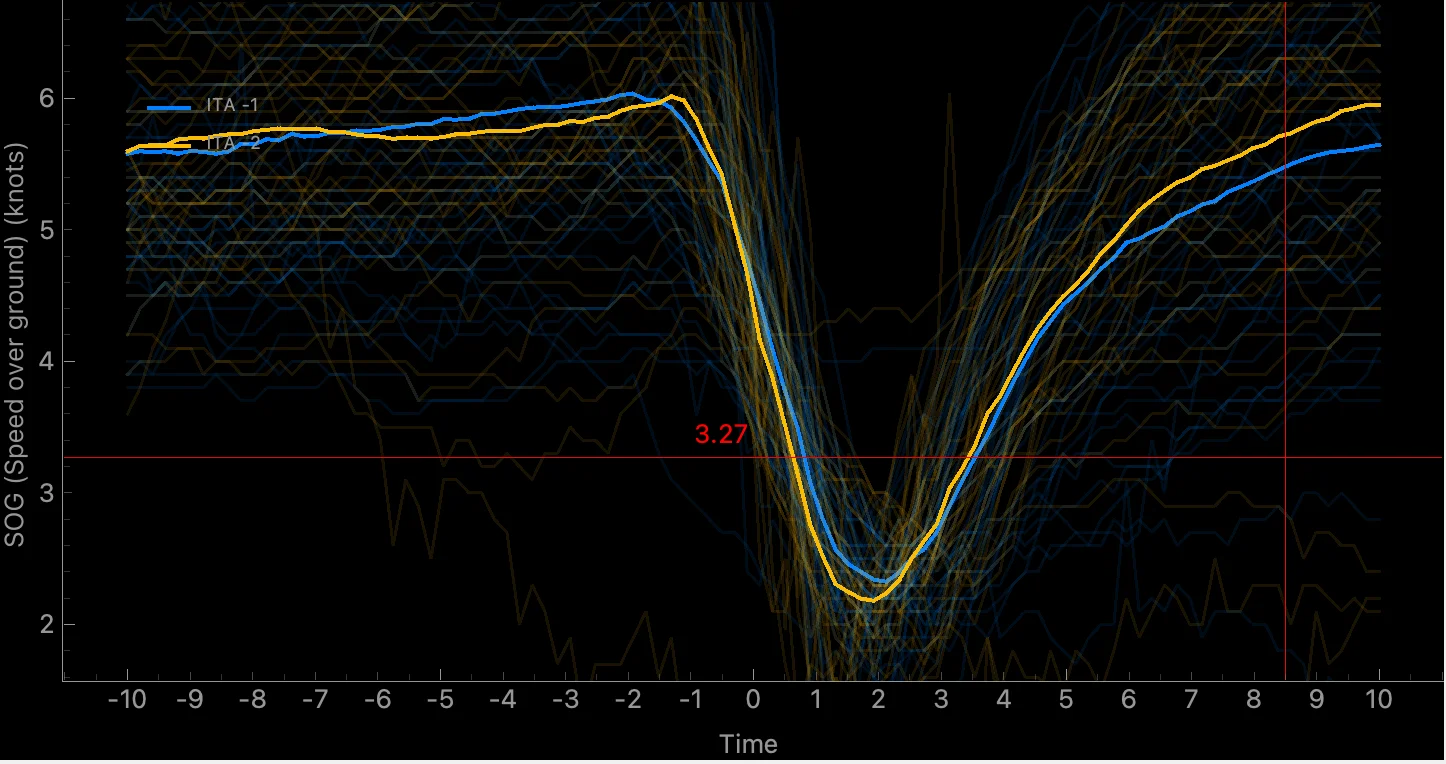
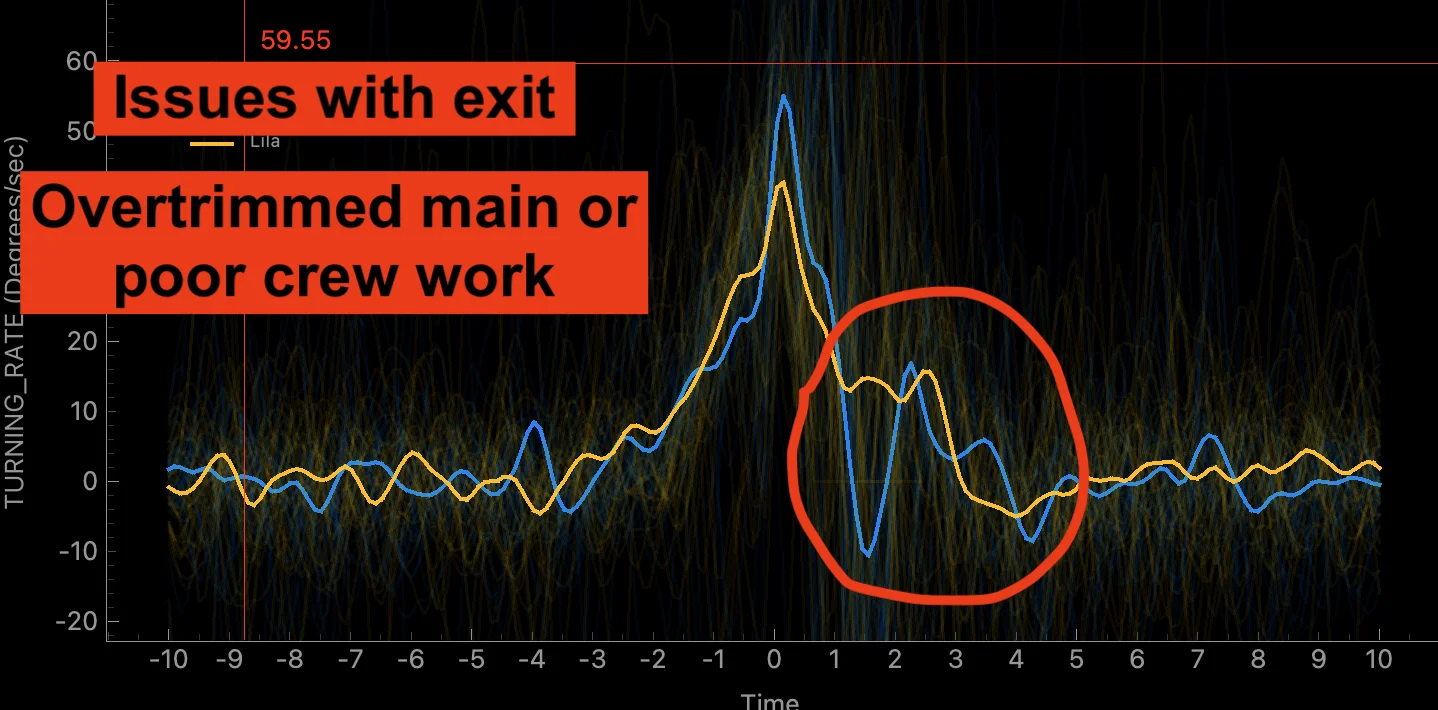
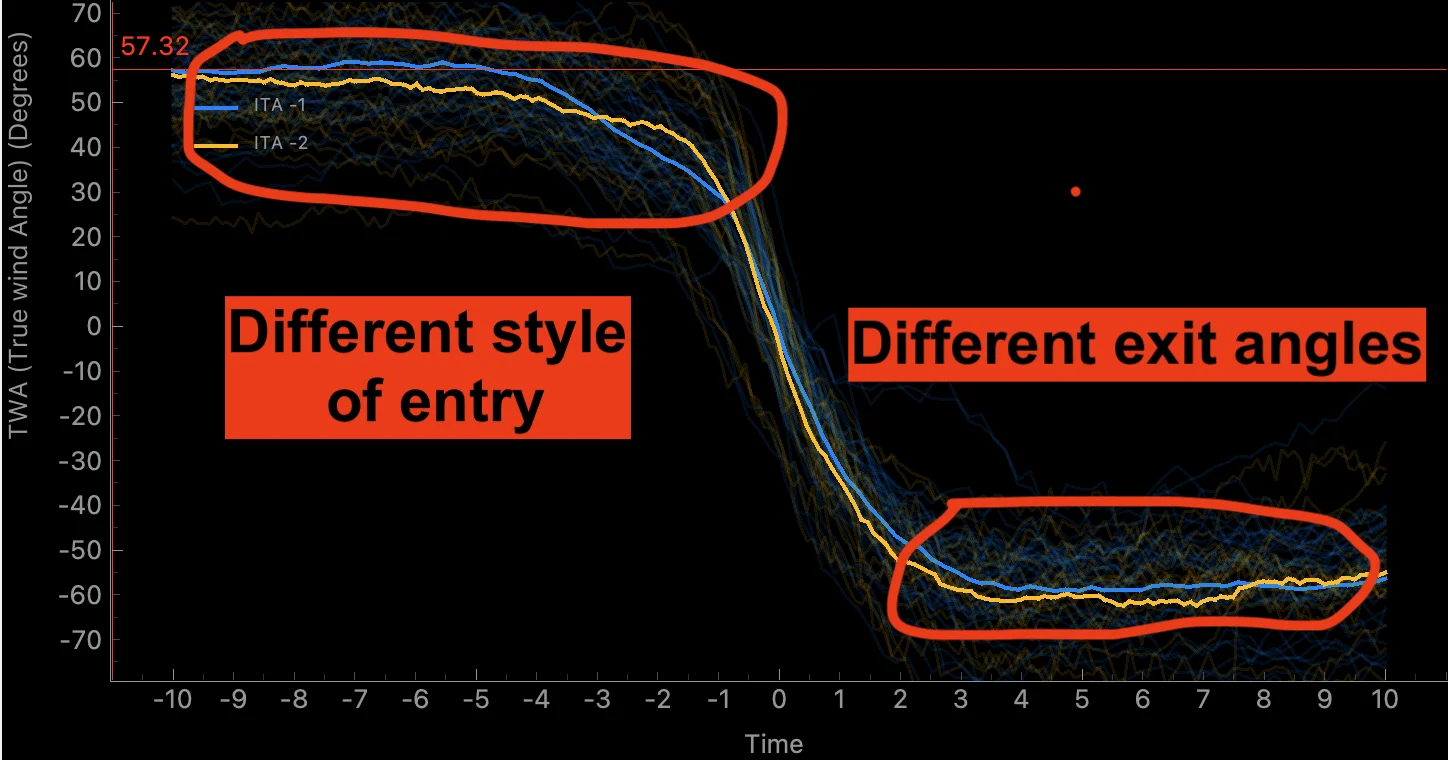
Maneuver Analysis — kTool
Maneuver Analysis • Speed & VMG focus

Maneuver analysis,
made simple.

Learn how to read your tack/gybe graphs second-by-second — and turn every maneuver into free speed.

What we’re optimizing

Our goal during maneuvers is simple: maximize total distance and VMG distance, while keeping the maneuver short and minimizing distance loss.

We want more of this

Total distance VMG distance Flow / stability

We want less of this

Duration Distance loss Extra rudder drag

The #1 rule: read it from start to finish

When we analyze a maneuver, we don’t jump to the peak or only look at the exit. We go from the first second to the last second, step-by-step, so we understand what caused what.

Think “timeline”

The boat has inertia. The speed curve often reacts to what happened a moment earlier — so we always connect actions to delayed effects.

Use graphs together

Speed alone rarely tells the full story. We cross-check Speed with Heel and Turning Rate (and later TWA and Pitch).

How to analyze a maneuver

Follow this order. It keeps the debrief clean, quick, and consistent — and it’s easy to repeat for every tack/gybe.

Step 1

Start fast: entry speed matters

The first thing we check is entry speed. A higher entry speed usually means a more efficient maneuver: you can use less rudder, the boat keeps flowing, and you travel more distance in the same time.

In most cases, the boat that enters faster already has an advantage.

Tip: If two maneuvers look similar, entry speed often explains the difference in outcome.
SPEED GRAPH PLACEHOLDER Insert photo / video / GIF later
Step 2

Delay the speed drop

Next, we watch how speed changes second-by-second. In general: the later the speed starts dropping, the better.

Because the boat has inertia, the speed graph reacts to actions you already did a moment earlier.

Common reasons for an early speed drop

  • Too much leeward heel during entry
  • Too much steering / rudder movement
  • (Some classes have additional, class-specific reasons)
Quick check: Heel (top-right) + Turning Rate (bottom-left) usually reveals the cause fast.
HEEL GRAPH PLACEHOLDER Insert photo / video / GIF later
Step 3

Heel control: smooth in, intentional out

On the heel graph, we want a smooth transition from our target heel toward right as we enter the maneuver.

On exit, we want one of two patterns

  • Stronger wind: smooth build from 0° back to target heel
  • Light wind: leeward heel + a sail pump to get back to target heel

Excess leeward heel on entry often creates a mismatch between the center of lateral resistance and the center of sail force, adding drag and slowing the boat. Some boats can benefit from the turning moment, but for most classes it’s not worth the speed loss.

HEEL TRANSITION PLACEHOLDER Insert photo / video / GIF later
Step 4

Turning Rate: smooth “dome”, not a shaky line

Turning Rate is how fast the boat rotates, measured in degrees per second (°/s). At the start of a maneuver you’re moving faster than at any other time inside it — so you usually need less rudder than when you’re slow.

Think of it like driving: on a highway you barely move the wheel; at parking speed you turn it a lot.

Goal: a clean, dome-shaped curve — smooth build-up, peak in the middle, smooth release — without wobbling at the start or the end. This usually means less water resistance and a more efficient maneuver.

If you see “wobble”, it often means extra rudder corrections and extra drag.
TURNING RATE GRAPH PLACEHOLDER Insert photo / video / GIF later
Step 5

Don’t stay slow

In the middle of the maneuver, the key is that the boat doesn’t “sit” at minimum speed. The deceleration phase should switch into acceleration as quickly as possible.

Add an arrow on the Speed graph showing where acceleration should start.
SPEED GRAPH + ARROW PLACEHOLDER Insert photo / video / GIF later
Step 6

True Wind Angle: are you exiting too high?

A common reason for slow acceleration is either heel issues or an exit angle that’s too high into the wind.

Open True Wind Angle (TWA) and compare the value at maneuver entry vs after the maneuver is completed. If the difference is large, it can explain why the boat struggles to build speed again.

Quick note: during a tack or gybe, TWA swings rapidly as you cross the wind — this is normal.
TWA GRAPH PLACEHOLDER Insert photo / video / GIF later
Step 7

Crew timing: Heel + Pitch tell the story

Another common reason for slow acceleration is crew positioning and timing.

To spot it, compare entry vs exit using Heel and Pitch (fore–aft trim). Even without video, these graphs often show whether the boat stayed flat and flowing — or got “stuck” because of movement at the wrong time.

PITCH / HEEL PLACEHOLDER Insert photo / video / GIF later

Quick reading tips

If you’re short on time, these checks often get you to the right conclusion in under a minute.

Speed shape

Gentler speed drop and quicker recovery usually means a better maneuver.

Turning Rate shape

Peak in the middle, smooth entry and exit — no shaking or corrections.

Compare graphs together

Speed + Heel + Turning Rate + TWA is the fastest combo for finding the real cause.

Repeatable process

Use the same step order every time. It keeps your debrief consistent and easier to improve.

Want feedback on your maneuvers?

Upload a session, open Maneuvers Analysis, and start with entry speed — we’ll take it from there.